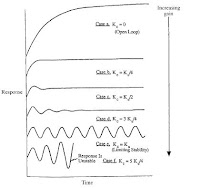
 It is common in industry to manipulate coolant in a jacketed reactor in order to control conditions in the reactor itself. A simplified schematic diagram of such a reactor control system. Assume that the reactor temperature is adjusted by a controller that increases the coolant flow in proportion to the difference between the desired reactor temperature and the temperature that is measured. The proportionality constant is Kc. If a small change in the temperature of the inlet stream occurs, then depending on the value of Kc, one might observe the reactor temperature responses shown in Figure.
The top plot shows the case for no control (Kc = 0), which is called the open loop, or the normal dynamic response of the process by itself. As Kc increases, several effects can be noted. First, the reactor temperature responds faster and faster. Second, for the initial increases in Kc, the maximum deviation in the reactor temperature becomes smaller. Both of these effects are desirable so that disturbances from normal operation have as small an effect as possible on the process under study. As the gain is increased further, eventually a point is reached where the reactor temperature oscillates indefinitely, which is undesirable. This point is called the stability limit, where Kc = Ku, the ultimate controller gain.
Increasing Kc further causes the magnitude of the oscillations to increase, with the result that the control valve will cycle between full open and closed. The responses shown in Figure are typical of the vast majority of regulatory loops encountered in the process industries. On the figure shows that there is an optimal choice for Kc, somewhere between 0 (no control) and Ku (stability limit). If one has a dynamic model of a process, then this model can be used to calculate controller settings.
In Figure, no time scale is given, but rather the figure shows relative responses. A well-designed controller might be able to speed up the response of a process by a factor of roughly two to four. Exactly how fast the control system responds is determined by the dynamics of the process itself.